 Back in November I realized that my weight was getting out of control (again). I started working with the folks at The Happy Body with great results. While following their exercise and diet approach was working wonders, I still found I had the daily bi-polar reaction to my scale. If my weight was down, I was happy. If it was up, then I was in a foul mood. Ran across The Hacker's Diet and in particular the chapter on Signal to Noise and it really struck a chord with me.
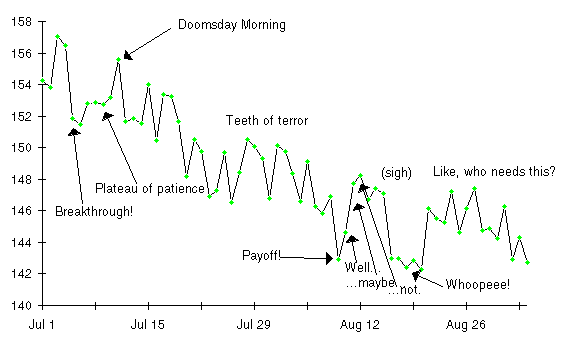
The following figure from The Hacker's Diet gives you an example of what I'm talking about.
The solution to this graph of terror is proposed by John Walker in the book: look to the trend. Don't get too focused on your daily fluctuations. Walker, being a hacker, has built some great tools for computing and graphing trends based on your daily weigh-ins. The graph at the top of this post is generated from my daily measurements for 2009. The red line is the trend. The floaters and anchors show the daily weights. More anchors than floaters means you're headed in the right direction, the trend is headed down. If you see a bunch of floaters showing up on the graph, then it's time to buckle down because the trend will be heading up if you don't get things back under control.
The Hacker's Diet has a lot of great advice and the combination of a free online web tools is very useful as well. I would recommend the online tools over the spreadsheets. Excel is just evil, in my opinion.
I would like to thank John Walker for taking the time to put his weight loss knowledge online for the rest of us.
Monday, March 2, 2009
Hacker's Diet
Posted by
adam
at
8:41 AM
![]()
![]()
Labels: diet, online tools, weight loss

